Everything you need to understand your audience (even if it's ChatGPT visiting!), in plain language.
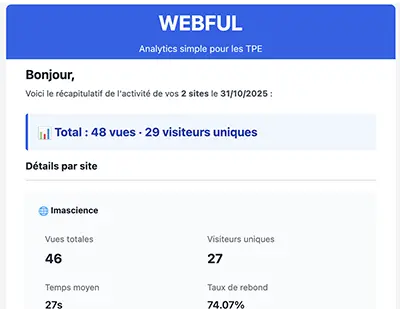
Webful provides an accessible and actionable health report for your website.
Like a technical inspection for your car, we check the essential points of your online presence: traffic, performance, SEO and accessibility.
With one goal: give you the keys to concretely improve your visibility.
No technical jargon, no confusing tables. Just clear indicators and actionable recommendations.
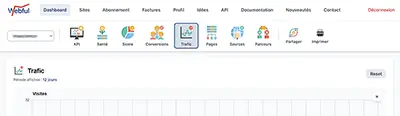
Discover a dashboard where every piece of information is just a click away. Smooth navigation, clean design and intuitive organization: move from one section to another instantly, without ever getting lost.
Visual and colorful interface that makes data analysis enjoyable
Instant navigation between all sections without reloading
Clear and logical organization: find the info you're looking for at a glance
No training required: everything is intuitive, you're autonomous from your first visit

Manage all your sites or those of your clients from a single Webful account. Switch from one site to another in one click to view statistics without logging back in.

Your site rated out of 100. The metrics to watch, without getting lost in data.
Page views
2,847
+12% vs previous period
Visits
1,847
+10% vs previous period
Unique visitors
1,249
+8% vs previous period
Avg. time
2m 34s
+15% vs previous period
Bounce rate
42%
-5% vs previous period
KPIs adapt to your site. Choose the metrics that matter to you.
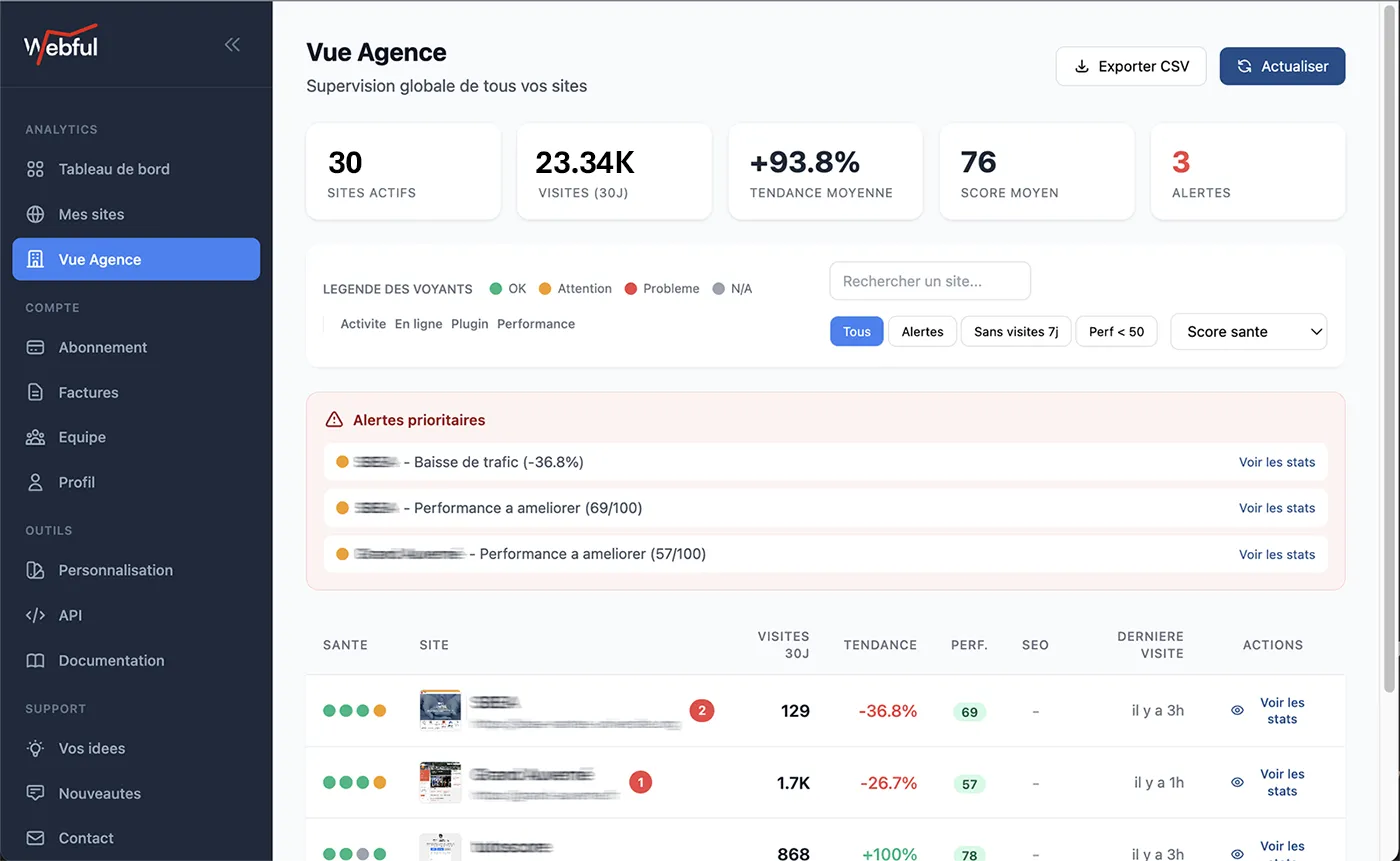
For agencies: The Agency View dashboard displays the average score across all your client sites. Instantly identify sites that need your attention.

A score from 0 to 100 that summarizes your site's health over different periods. See at a glance if your site is progressing, stagnating or declining.
Good
Excellent
Very good
Very good
Automatic calculation: The score is updated daily by analyzing your traffic, performance and SEO.
Click on each period to see the details of the evaluated criteria.
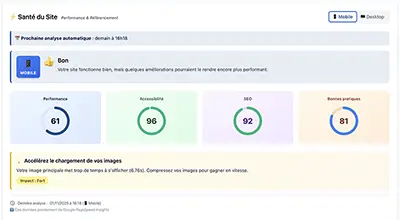

Webful automatically analyzes the critical points of your site: performance, SEO, accessibility, security. Receive a clear diagnosis with actionable recommendations.
For agencies: Detect SEO issues with your clients before they impact their visibility. Propose concrete corrective actions.

Track the actions that really matter for your business: phone calls, emails sent, form submissions, clicks on specific buttons.
Calls
47
Clicks on phone numbers
Emails
32
Clicks on email addresses
Forms
28
Form submissions
Key pages
156
Visits to your important pages
Automatic tracking: Webful automatically detects tel:, mailto: links and forms on your site.
Define your conversion pages (thank you, confirmation) to measure your conversion rate.

Webful analyzes your data to identify trends and alert you in case of anomalies. No need to constantly monitor your stats.
Smart detection: The algorithm learns from your history to distinguish normal variations from anomalies.
Configure your alert thresholds according to your activity to avoid false positives.

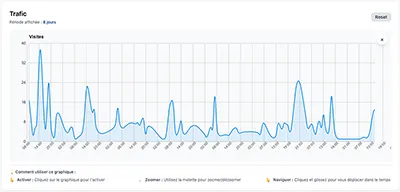
Visualize your traffic hour by hour, day by day or month by month. Zoom, filter, compare periods to identify patterns.
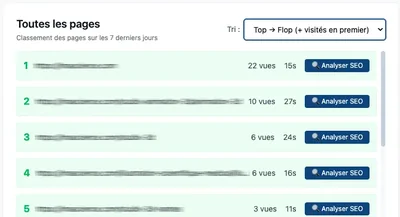

Identify your best performing pages and those that need improvement. For each page, Webful gives you concrete leads.

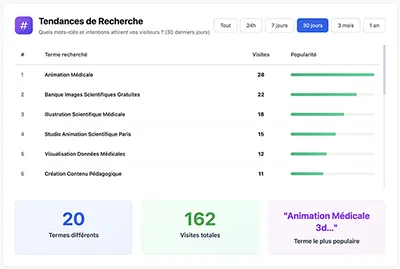
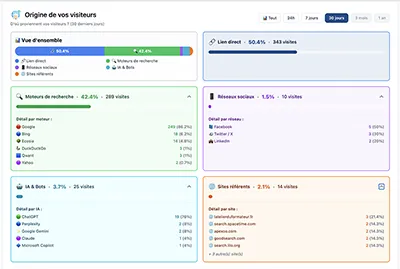
Where do your visitors come from? Google, social networks, referral sites, direct access... Understand your acquisition channels.
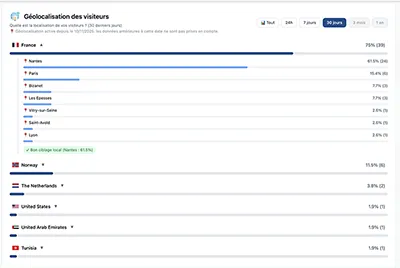

Discover where your visitors come from with city-level precision. Identify your markets and adapt your strategy.
For agencies: Verify that your local clients (shops, craftsmen) are reaching their catchment area. The "Good local targeting" badge confirms their strategy is working.
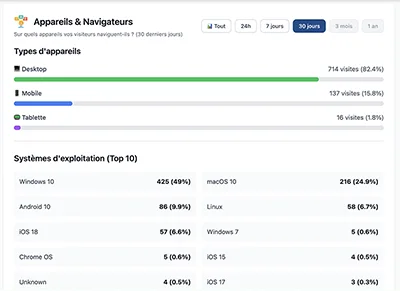

Understand how your visitors access your site: mobile, tablet, computer. Optimize the experience for each device.
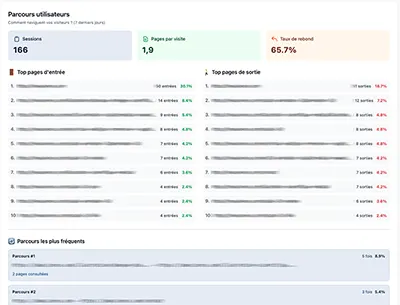

Discover how your visitors move around your site. Where do they enter? Where do they leave? What paths do they follow most often? Understand their behavior to improve your site.

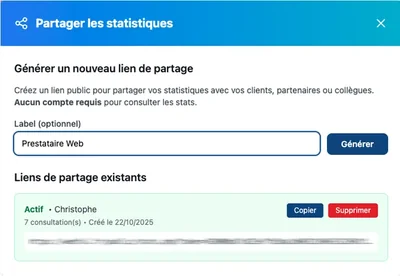
Give your clients access to their site statistics via a secure link. They view their data in real-time without needing your credentials, and you keep full control. Statistics update automatically in real-time - your recipients always see current data without needing a new export!
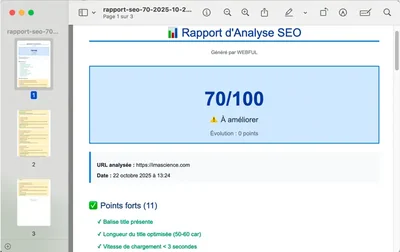

Generate professional PDF reports in one click. With the Agency plan, reports automatically display your logo and contact details for branded presentations to your clients.

Schedule automatic report delivery to your clients. Weekly or monthly, with your branding (Agency plan). Your clients receive their statistics regularly without you having to intervene.
Tip: Schedule your weekly report for Monday morning to start the week with a clear vision of your site. Ideal for entrepreneurs who don't have time to log in every day.


100% GDPR compliant by default. No personal data collected, no intrusive cookies, hosted in Europe. Your visitors are respected.
Pro, Agency and Agency+ plans include specific features to efficiently manage your clients. White label, centralized supervision, team collaboration: everything is designed for your professional activity.
Customize Webful's appearance with your logo, colors and contact details. Your clients only see your brand.
View all your client sites on one screen. Average score, priority alerts, smart filters.
Invite 3 to 5 collaborators depending on your plan. Your team accesses statistics without sharing your credentials.
Automate site management via REST API. Webhooks for real-time notifications.
Guaranteed response within 24h for Agency accounts. Support tailored to your context.
24 months of data retention for Agency plans. Analyze long-term trends.
Create your free account and start analyzing your site right now.
No credit card required - Cancel anytime